[clear]
On July 16th, WCA staff was present at the Version 2 Pre-Launch of the Location Affordability Portal. The portal is a product of Sustainable Communities, the partnership between the Department of Transportation, Environmental Protection Agency, and Department of Housing and Urban Development and the launch was one of only two throughout the nation.
Research shows that the average American family spends 52 cents of every dollar is spent on housing and transportation. The tool is intended to give families an extra metric for decision-making when it comes to choosing where to live and work. It combines the Location Affordability Index and the My Transportation Cost Calculator to provide the public with access to data on housing and transportation costs.
Cicely Garrett, of the Atlanta Community Food Bank, made a good point to the presenter about one fallacy of the tool: not taking into account the value of time. Especially here in Atlanta, where the rail system is less extensive than other cities, a wait for a bus, a transfer, and a ride on the train may take significantly longer than a ride in a car. Josh Geyer of the HUD Office of Economic Resilience, argues that time spent on public transit can be better utilized than time spent driving a car.
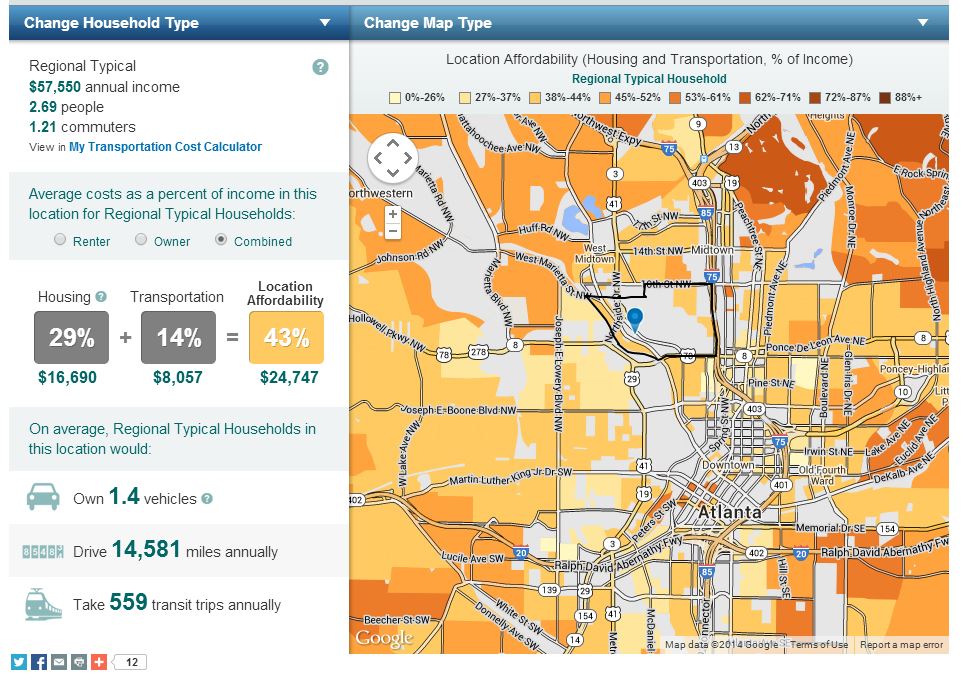
To use the portal, simply go to http://www.locationaffordability.info/ where you can explore both tools. In the Location Affordability Index, you can view annual averages (including number of residents per unit, number of vehicles owned, vehicle miles traveled, and transit trips) for your region by inputting your address.
The Transportation Cost Calculator creates a profile for you and your family based on where you live and work and how often you use a car compared to transit. You can even make multiple profiles for different housing or work options to see how one location compares to another in terms of affordability.
See highlight statements from the second panel: LAP_Panel2
See hand-out from the event: LAPhandouts.